
I wanted to streamline the process of tracking item inventory on a couple different diablo 2 resurrected web trading platforms. D2r is an rpg video game where you level up characters and collect items. You are able to trade those items in game with other players online.
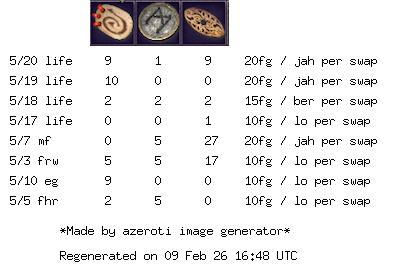
This application looks at a google sheet to see what items to track and the current inventory of each. It then generates an image that I can display on the trading websites without having to continually go and update the individual posts in the website when the inventory changes.

Every so often (currently configured to every 24 hours – I used to have it set for 5 minutes), the application polls for changes in the google sheet and if it finds any, it regenerates the image under the same url.
I used this application for a few months until I stopped playing the game. I’m sharing all the details here of how I setup this up and the code in the event it could benefit others.
Tech Stack
- golang
- nginx for SSL/https
- letsencrypt to manage SSL certs
- Grafana Allow to scrape prometheus metrics
- Grafana Cloud to visualize metrics
- Google Sheets to track inventory of items
- I had to generate a download link for the app to access the data as csv
Future Improvements
- use triggers within the google sheet to make an API call to the applicate to regenerate the image when the inventory changes instead of the application polling the google sheets.
Server Setup
Using a minimal shared resource instance running on Linux.
Installing go
Follow the instructions at https://go.dev/doc/install
via apt
sudo apt update
sudo apt install golang-go
Getting the code on the server
Normally you’d want some deployment process but for this app, I was ok pulling the latest and greatest on the server via git pull and running it.
create ssh key
ssh-keygen -t rsa
change perms
chmod 600 id_rsa
and add key to agent
eval "$(ssh-agent -s)"
ssh-add id_rsa
add public key to github doc
nginx
Decided to install nginx to handle HTTPS. You can also configure the go server to use the certs and allow HTTPS traffic but I don’t remember why I choose this route instead.
sudo apt install nginx
I then had to update nginx config for subdomains /etc/nginx/sites-available/default
Sample file with https enabled
server {
    server_name myexperiments.app d2r.myexperiments.app;

    location / {
        proxy_pass http://localhost:8081;
    }

    listen 443 ssl; # managed by Certbot
    ssl_certificate /etc/letsencrypt/live/myexperiments.app/fullchain.pem; # managed by Certbot
    ssl_certificate_key /etc/letsencrypt/live/myexperiments.app/privkey.pem; # managed by Certbot
    include /etc/letsencrypt/options-ssl-nginx.conf; # managed by Certbot
    ssl_dhparam /etc/letsencrypt/ssl-dhparams.pem; # managed by Certbot
}
server {
    if ($host = d2r.myexperiments.app) {
        return 301 https://$host$request_uri;
    } # managed by Certbot


    if ($host = myexperiments.app) {
        return 301 https://$host$request_uri;
    } # managed by Certbot

    server_name myexperiments.app d2r.myexperiments.app;
    listen 80;
    return 404; # managed by Certbot
then restart nginx
sudo nginx -s reloadSome helpful resources on this setup
- https://www.digitalocean.com/community/tutorials/how-to-deploy-a-go-web-application-using-nginx-on-ubuntu-18-04
- https://dcc.godaddy.com/control/portfolio/myexperiments.app/settings?itc=mya_vh_buildwebsite_domain&subtab=nameservers
Running the app
To run the app on the server, we’ll the nohup command to persist this process and it will log all output to a file nohup.out.
nohup go run main.go &
now navigate to the image url to verify it’s working
/images/azeroti.png
check it out: https://d2r.myexperiments.app/images/azeroti.png
TLS
Need to setup https, easiest way is using certbot which will configure nginx. Then we don’t need to handle tls certs in golang.
sudo apt update
sudo snap install --classic certbot
sudo ln -s /snap/bin/certbot /usr/bin/certbot
sudo certbot --nginx
Now we can access the site at: https://d2r.myexperiments.app/images/azeroti.png
Helpful link on this topic
- https://github.com/gin-gonic/autotls
- https://certbot.eff.org/instructions?ws=nginx&os=debianbuster
- https://eff-certbot.readthedocs.io/en/latest/using.html#changing-a-certificate-s-domains
Grafana Alloy
We are generating prometheus metrics in the /metrics endpoint. These need to be scraped and sent to the grafana collector so we can see them displayed in our dashboard. I’m using grafana cloud and they provided some docs on the setup.

They provide you with a script you run on the linux server that installs and configures alloy. Next you want to update the default scraping target from port 12345 to 8081 by editing the /etc/alloy/config.alloy file and adding:
targets = [{
    __address__ = "127.0.0.1:8081",
  }]
forward_to = [prometheus.remote_write.metrics_service.receiver]
Once you restart alloy by using the command sudo systemctl restart alloy.service you should be able to test the integration and see metrics start trickling in if you load the URL for the PNG image.
For a local MacOS setup
You can install alloy via brew and you could also do the configuration mentioned above for the port or the alloy command allows passing a param as well to achieve the same. Some notes:
Alloy uses a configuration file that you can customize before running:
  /opt/homebrew/etc/alloy/config.alloy

To start grafana/grafana/alloy now and restart at login:
  brew services start grafana/grafana/alloy
Or, if you don't want/need a background service you can just run:
  /opt/homebrew/opt/alloy/bin/alloy run /opt/homebrew/etc/alloy/config.alloy --server.http.listen-addr\=0.0.0.0:8081 --storage.path\=/opt/homebrew/var/lib/alloy/data

  brew services start alloy
  brew services stop alloy
  # need to stop when done using else it will start on startup

  brew edit alloy
  # to edit the localhost port and url
Some helpful links on this topic
Conclusion
Here is the repo with all the code/details if you want to try it out: https://github.com/joeyrivera/d2r-inventory-image